|
|
Epoch Folding
Working the technology in a such a way reinforces the concept of utilizing data
and operating algebraically on a whole set of data. If the teacher chooses to
reinforce this concept using the graphing calculator, the procedure and its
options are outlined below.
- First, the data (secs and intensity) from GX301-2 should be uploaded into
the teacher's calculator. It can be inputed into the calculator in Lists named as SECS(time) and INT(intensity). See below.

Do you want to know how to name lists?
- Now link the data from the teacher's calculator to all of the student's
calculators.
Do you want to know how to link lists?
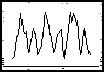
- The teacher may choose to show students how they could plot the data
using the graphing calculator. The plot should mimic the graph contained in this lesson. See below.
Do you want to know how to plot the data entered?
- Just like we did for the Epoch Folding procedure previously, we will need
to guess the correct P, and divide the data up into time bins. See below.

In this case the data were put into 3 lists of data each containing 27 bins of data.
- We must now algebraically operate on all 3 lists of binned data in order
to calculate the folded data. Specifically we must determine the average
intensity for each time bin.
Do you want to know how to algebraically determine the average intensity for each time bin?
- Once we do that, we have data ready to be plotted and checked for
correctness. You must now go to "STAT PLOT" and input correctly a line
plot, and time vs. Intensity correctly in the data.
|